
iXamin
Data, examined.
Ontario’s Electricity Rates
With water, an economic shock.
2016-12-04
Built with R version: 3.3.2. with data scraped or sourced from http://www5.statcan.gc.ca/cansim, http://www.ontarioenergyboard.ca, and http://www.ontario-hydro.com/current-rates.
See the code at https://github.com/ixamin/ixamin.github.io
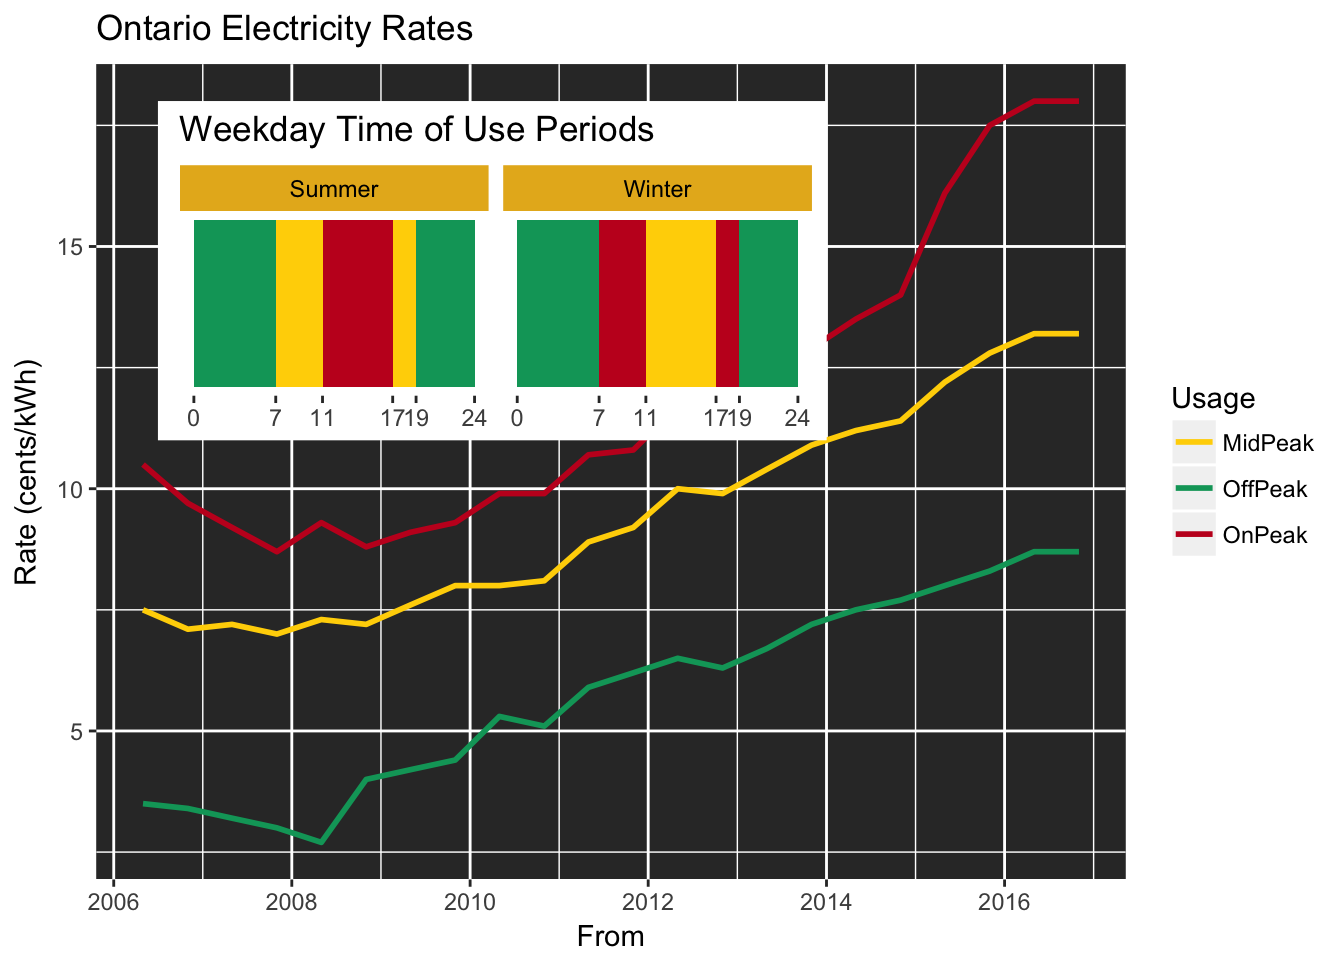
Ontario’s Time-of-Use rates have been steadily increasing, with the “On Peak” rate rising the most rapidly in
the last three years.1
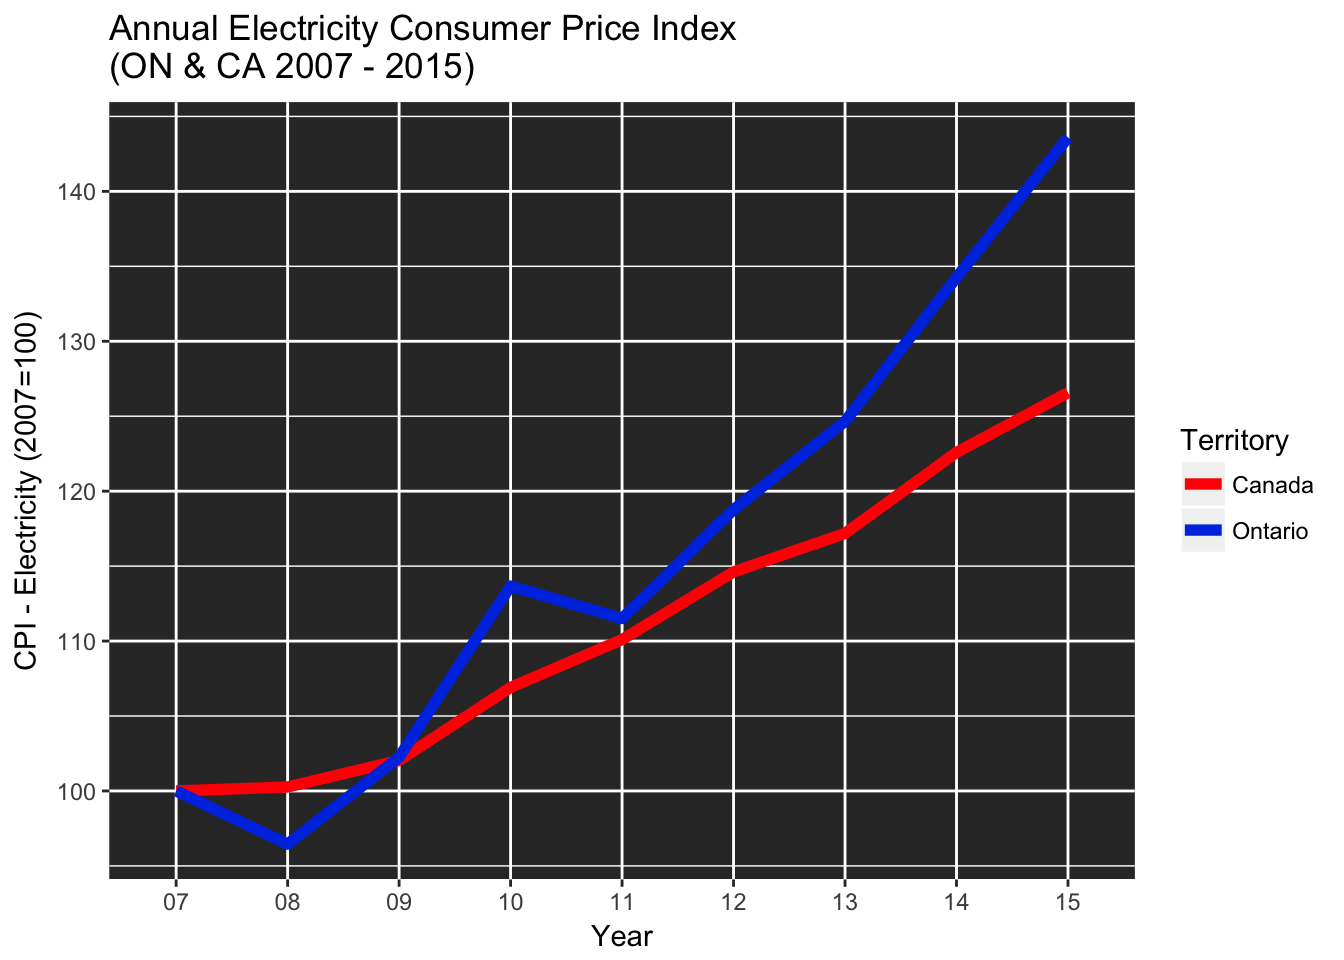
In the same period, Ontario’s Electricity CPI has risen more rapidly than the Canadian average.2
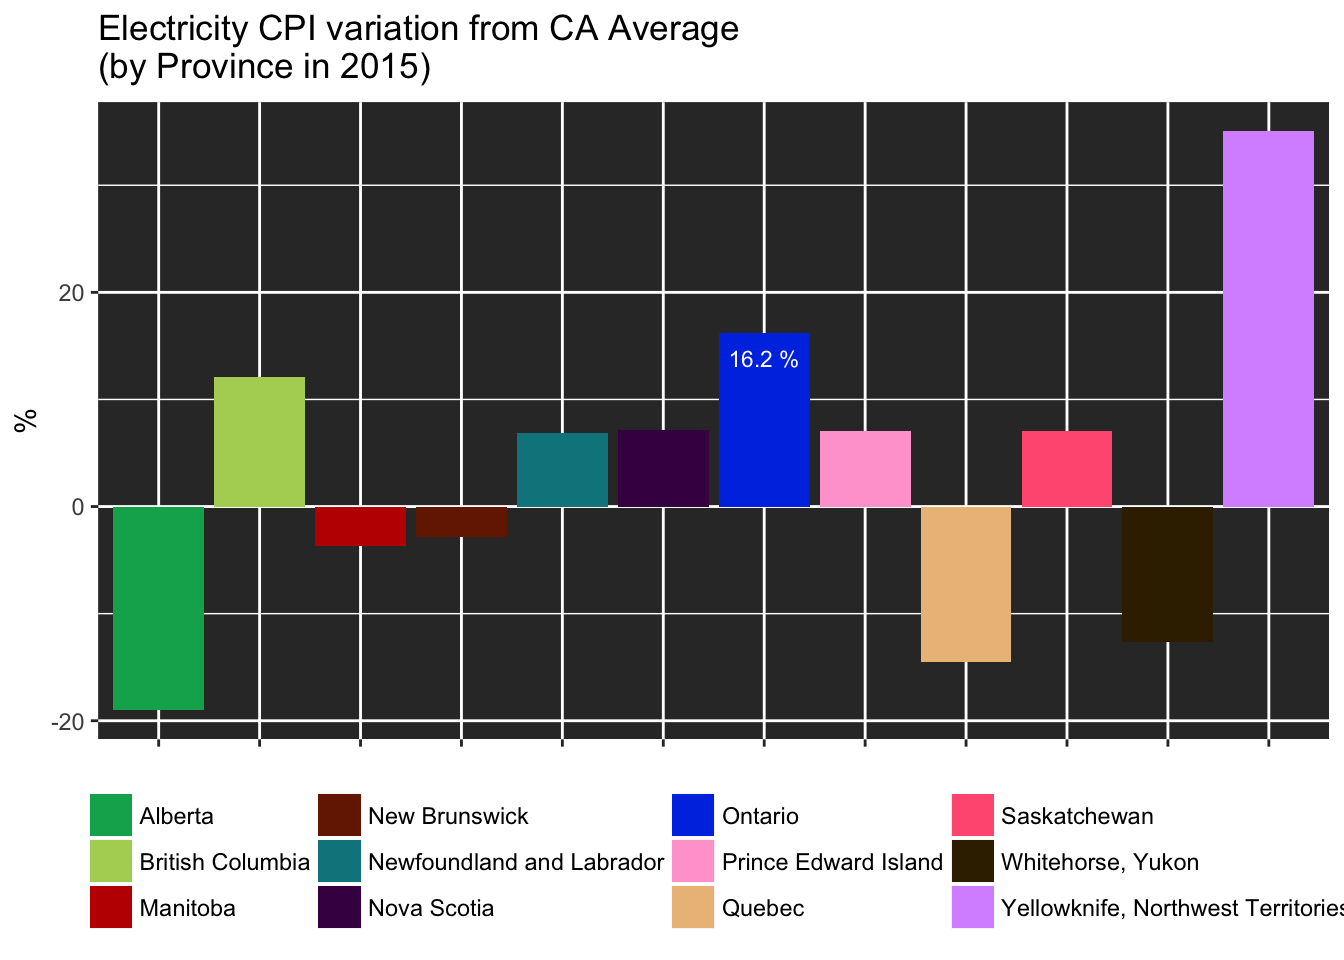
In 2015, Ontario had the highest provincial Electricity CPI variation from the country’s average. The
Northwest Territories is the only region having a greater variation.3
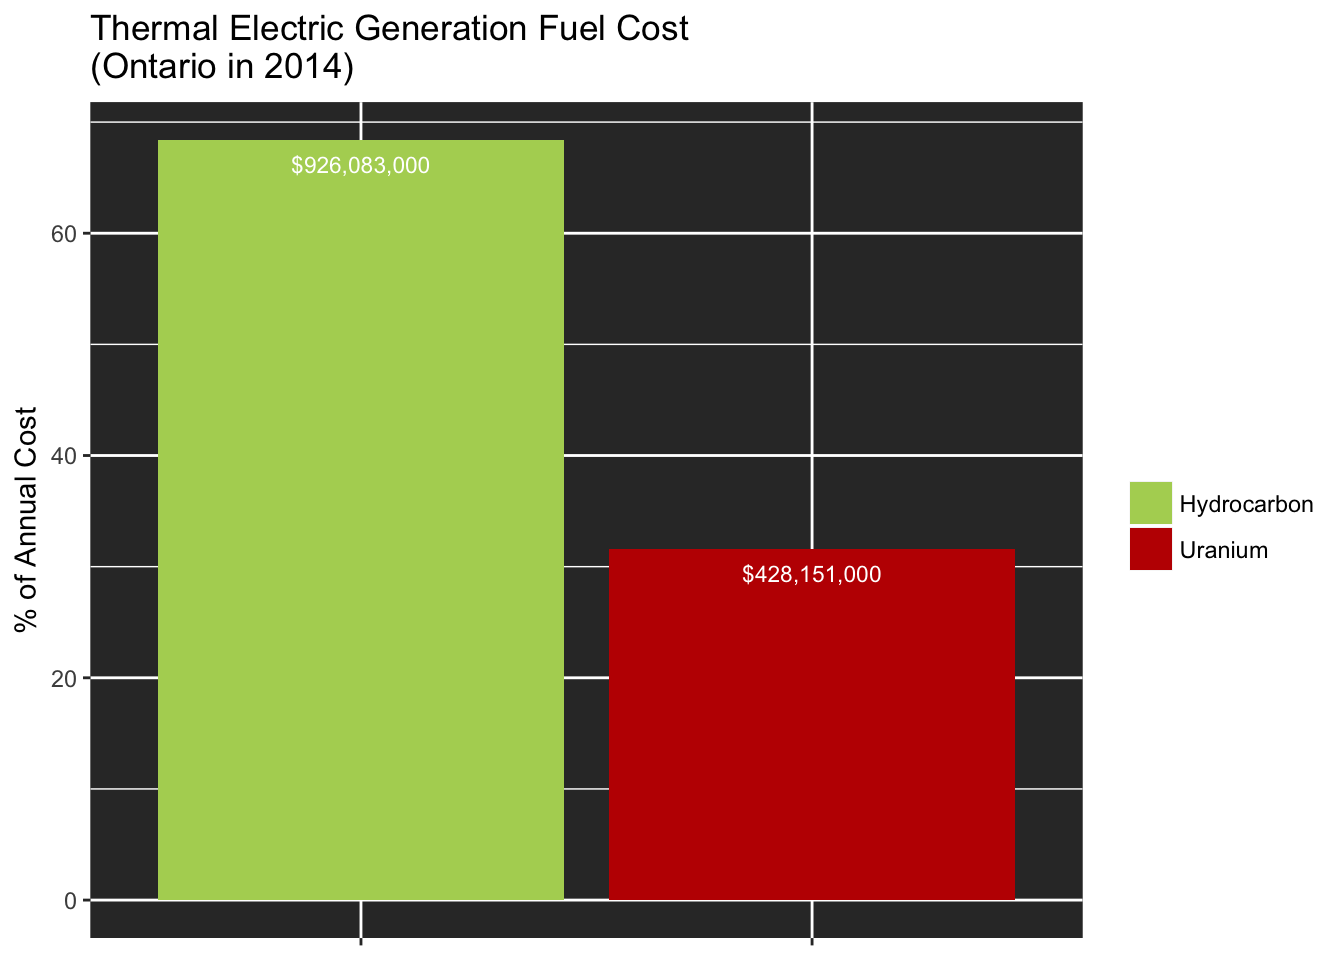
Nuclear power is the largest source of electricity in Ontario.4
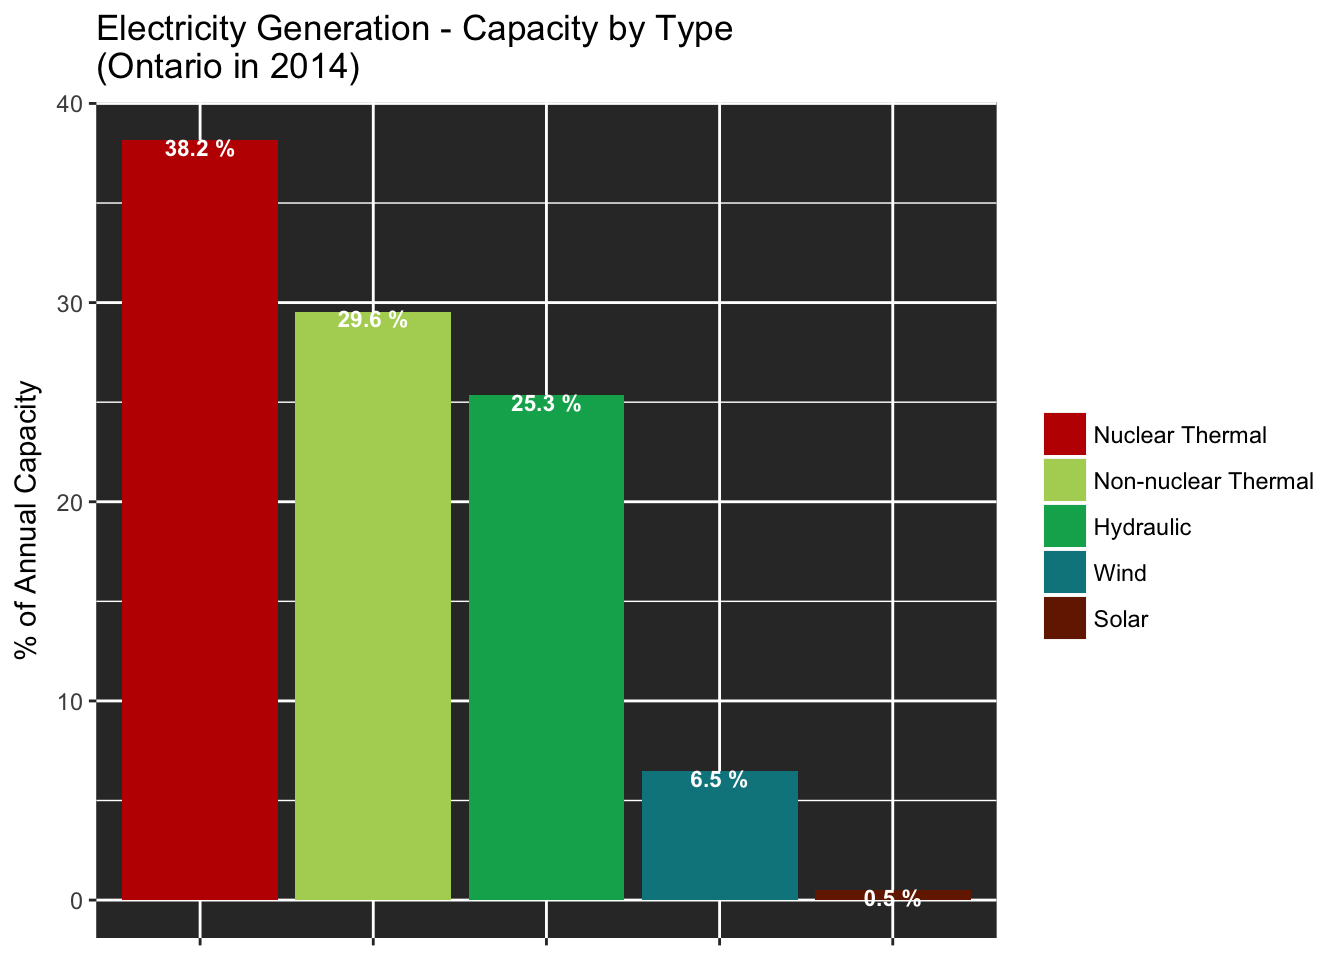
Nuclear fuel is about a third of the total provincial cost; hydrocarbon driven thermal electric generation
costs the most.5
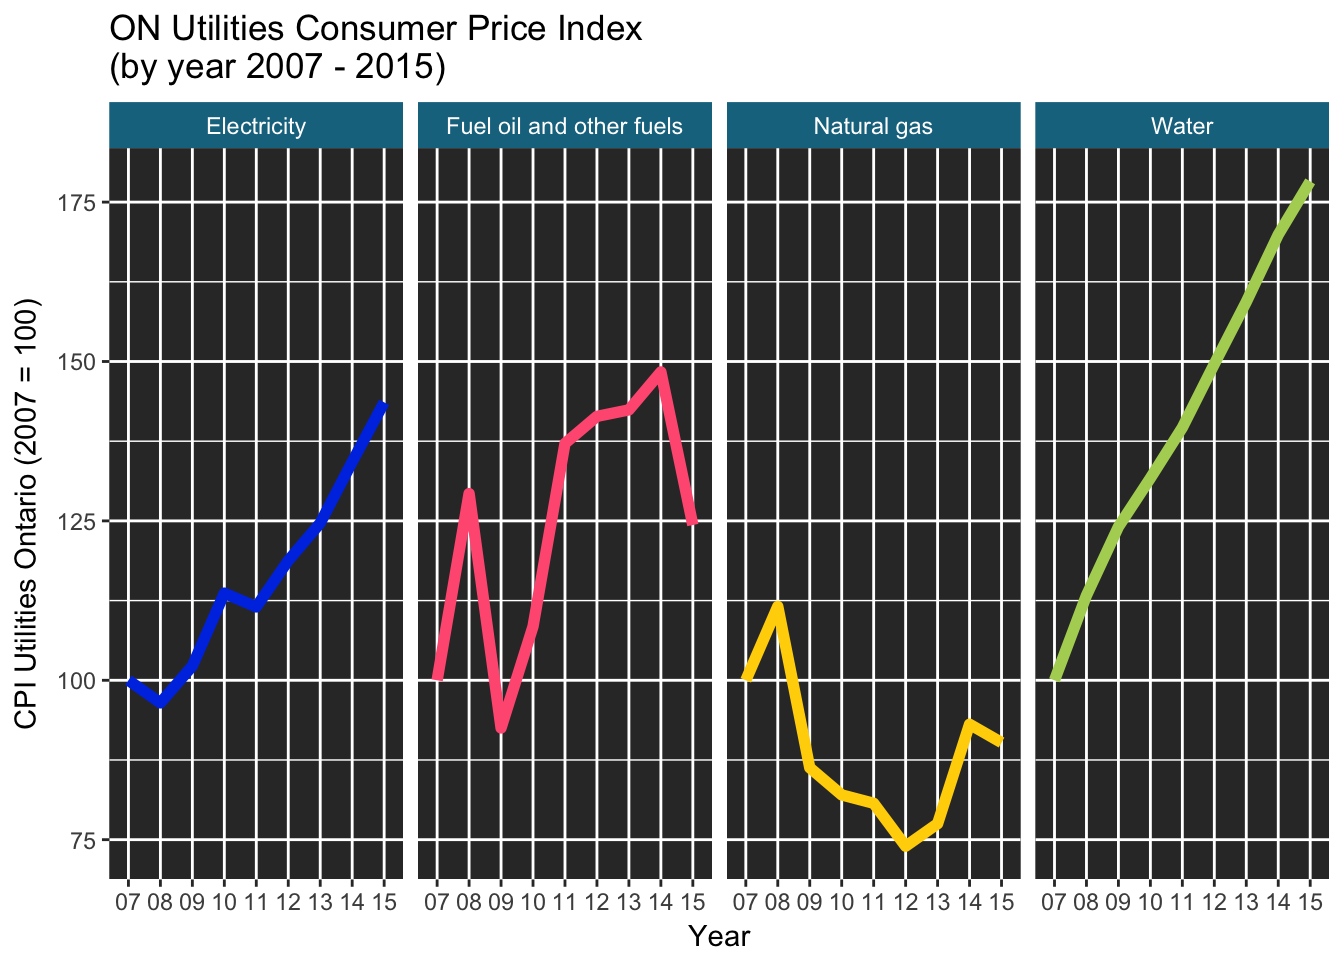
Unless a household heats with electricity, the alternate typical heating sources are reflecting a lower
recent Consumer Price Index. However, the CPI of water is higher and increasing faster than electricity.6
-
Source: ontario-hydro.com↩
-
Source: ontarioenergyboard.ca↩
-
Source: statcan.gc.ca↩
-
Source: statcan.gc.ca↩
-
Source: statcan.gc.ca↩
-
Source: statcan.gc.ca↩